On September 12, 2022, a 1-km grid global population distribution projection dataset was released by Ying Long’s group, and the data descriptor of this work, entitled ‘Projecting 1 km-grid population distributions from 2020 to 2100 globally under shared socioeconomic pathways’, was published online by Scientific Data, an open-access journal launched by Nature Research.
Population distributions population grid can play an important role in climate change, resource management, sustainable development and other fields. Several gridded datasets already exist, but global data, especially high-resolution data on future populations are largely lacking.
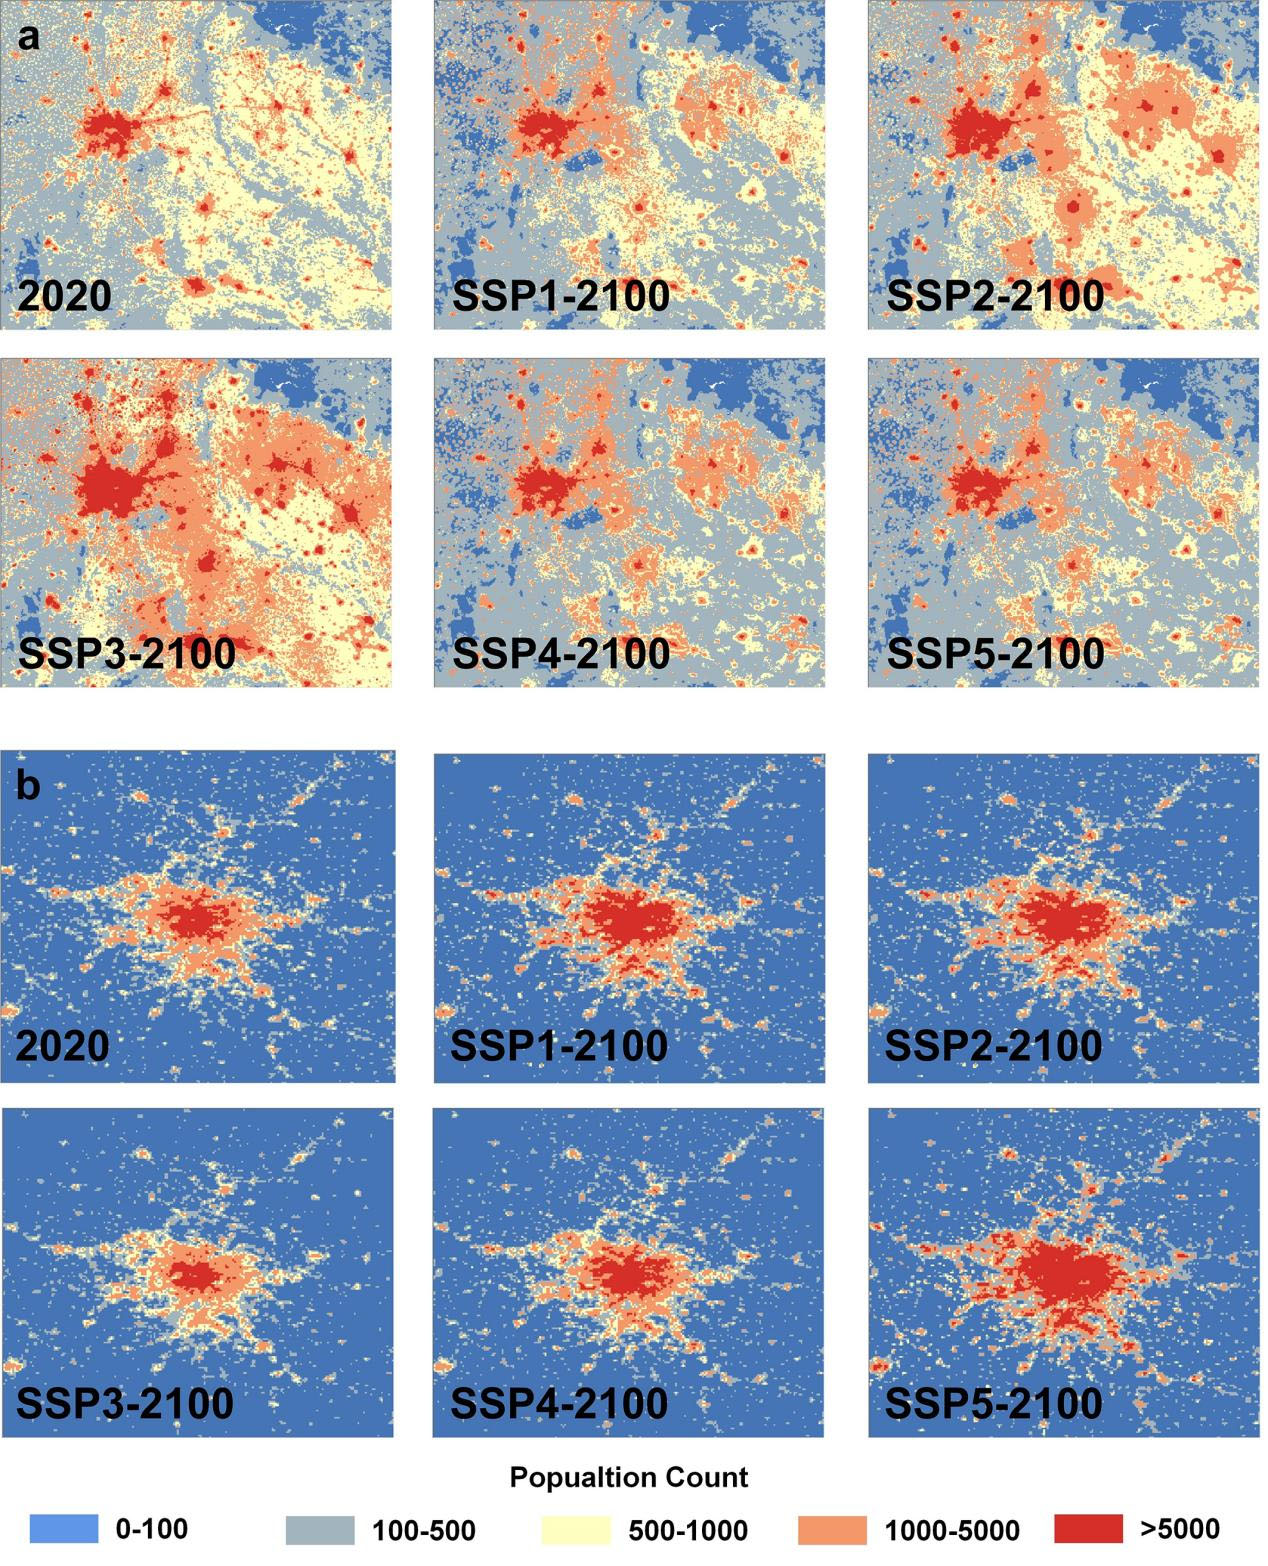
Based on the WorldPop dataset, we present a global gridded population dataset covering 248 countries or areas at 30 arc-seconds (approximately 1 km) spatial resolution with 5-year intervals for the period 2020–2100 by implementing Random Forest (RF) algorithm (Figure 1).
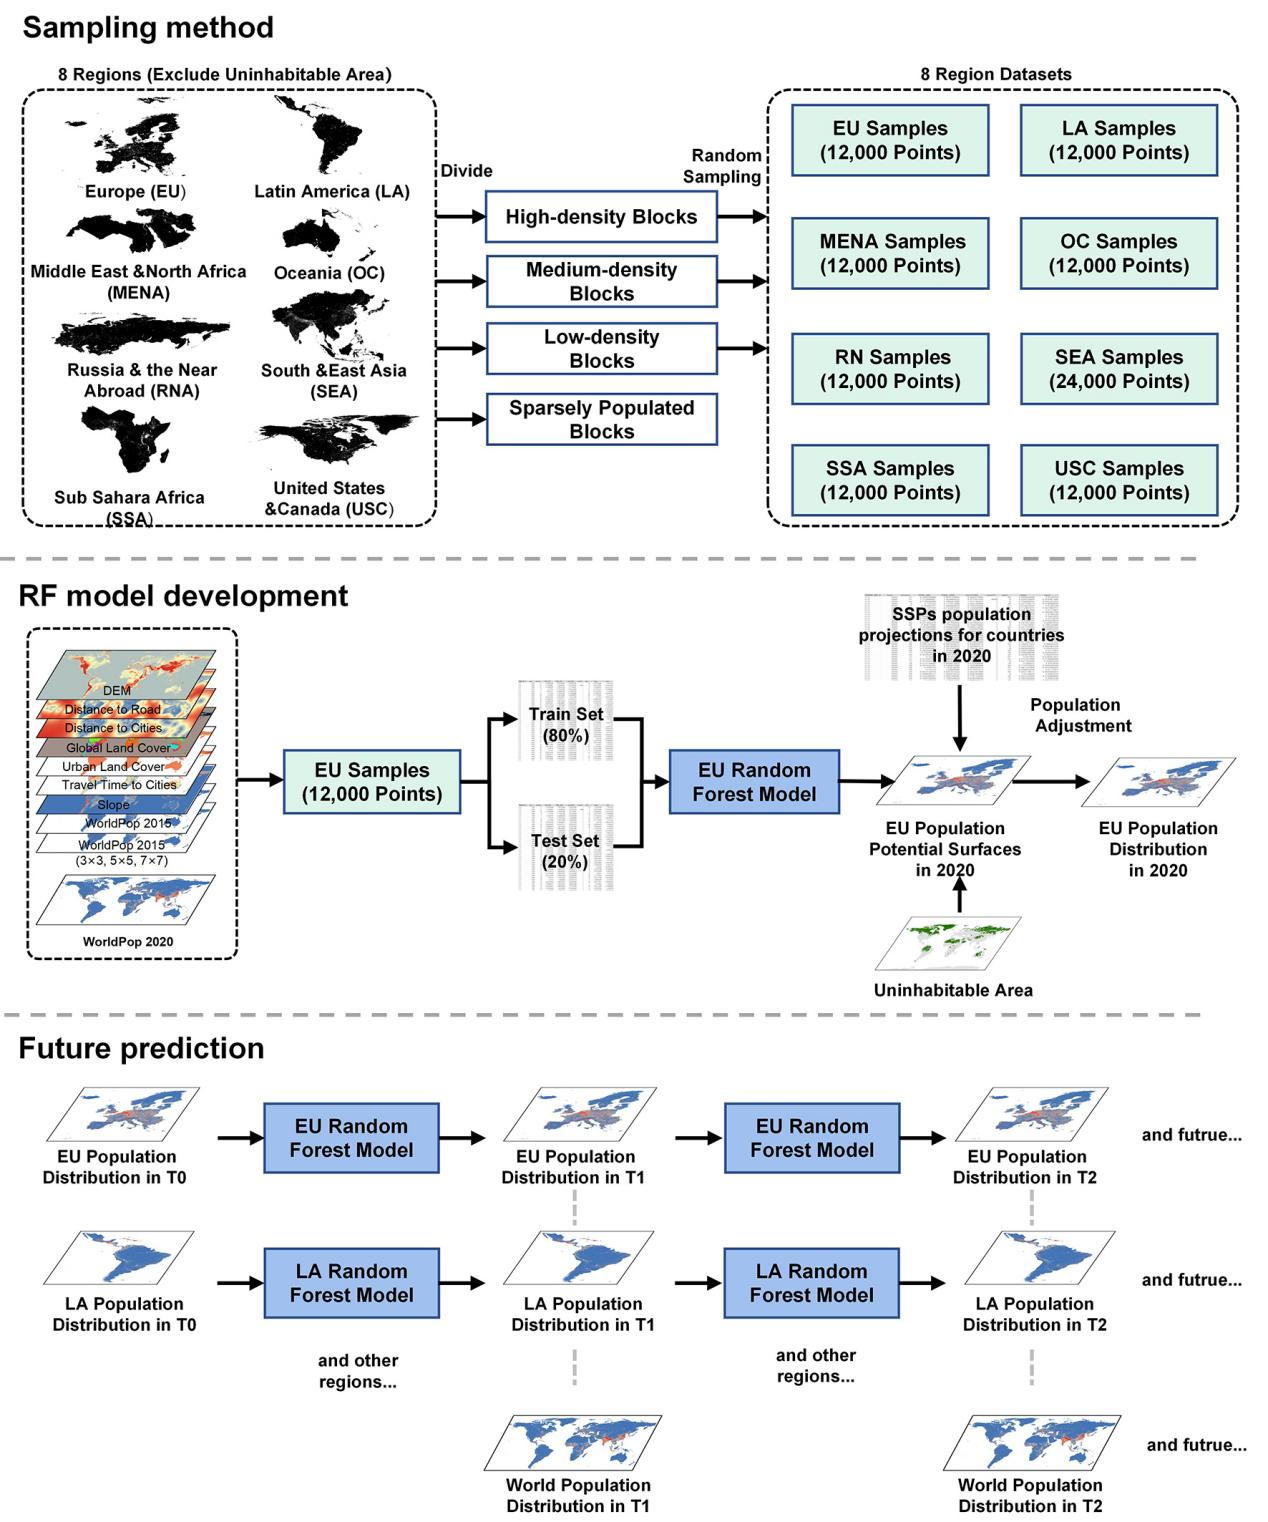
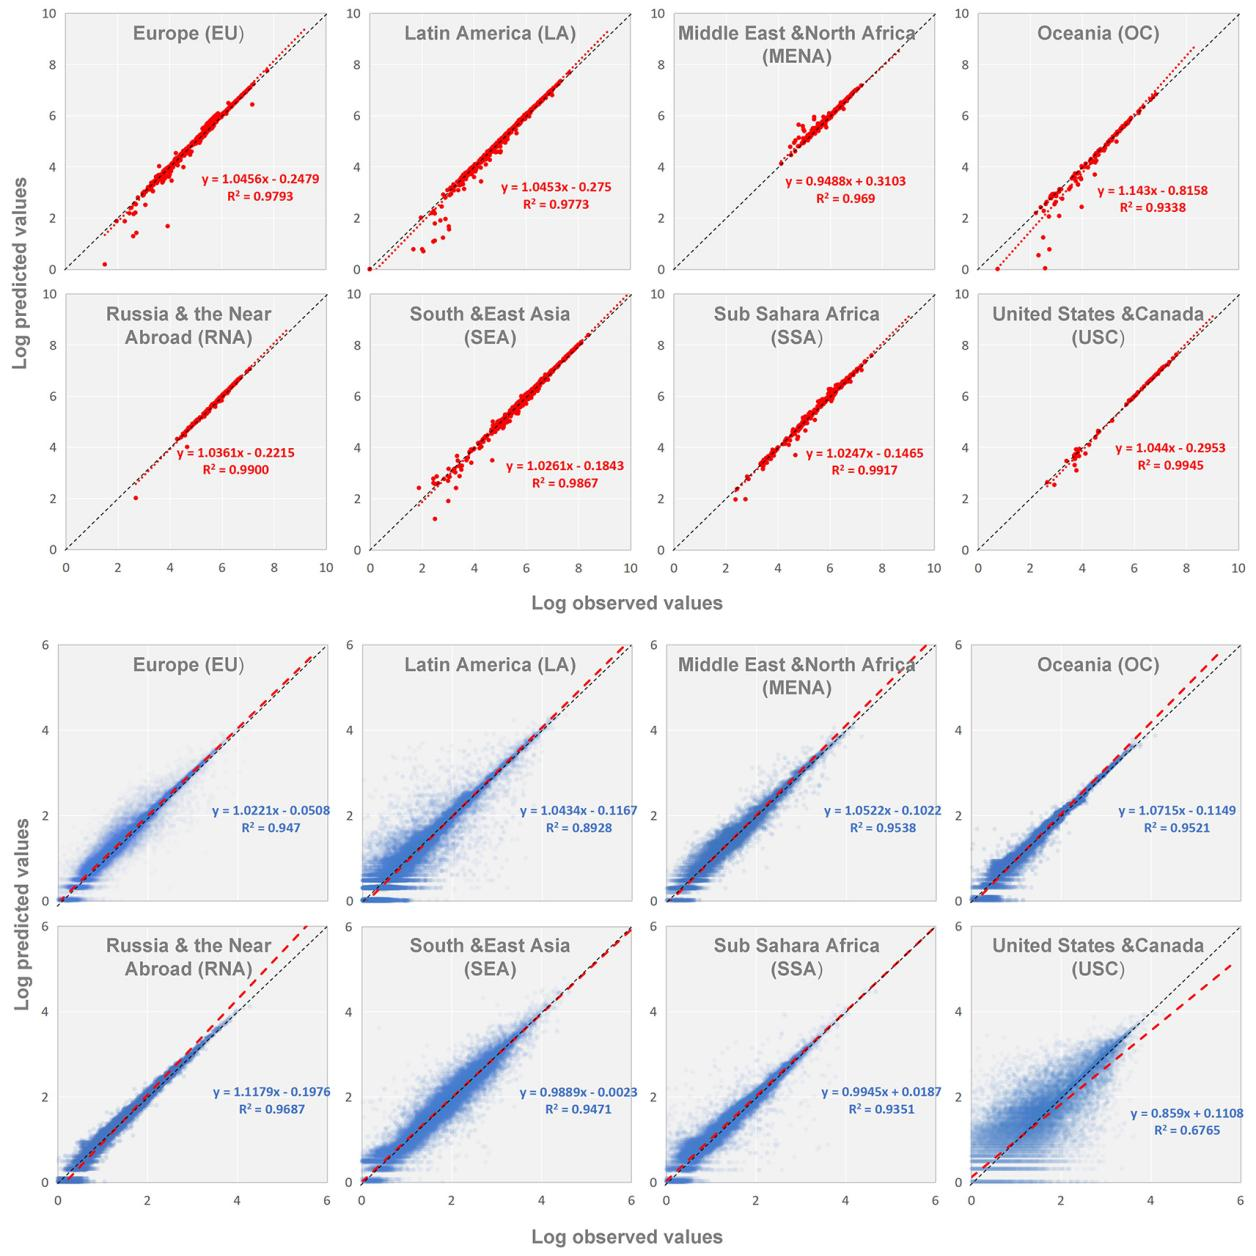
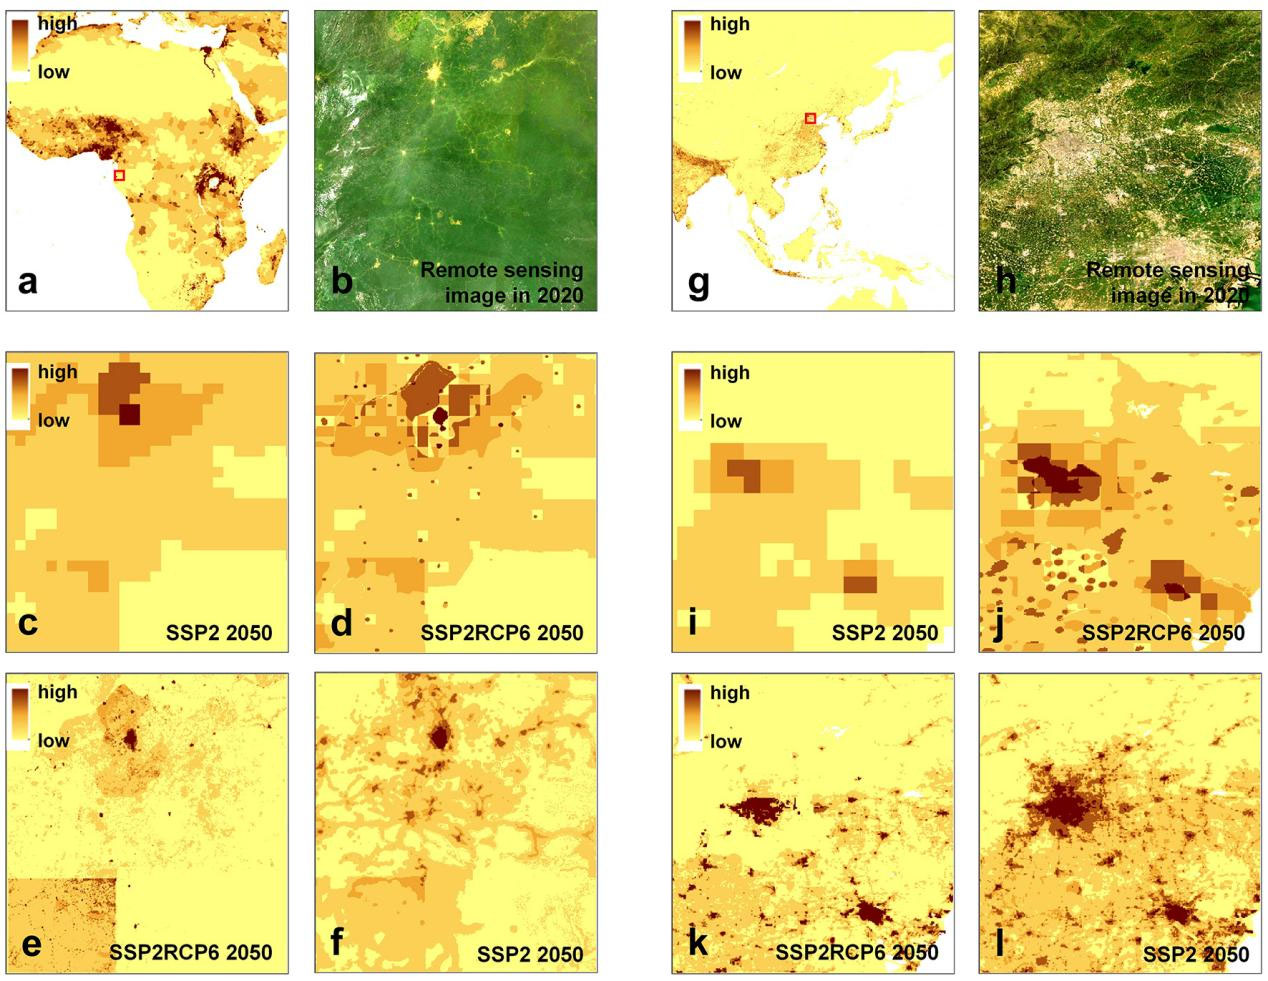
Our dataset is quantitatively consistent with the Shared Socioeconomic Pathways’ (SSPs) national population. The method involves three procedures (Figure 2): (1) preparations before projection (Sampling method), (2) calculating projection model (RF model training) and (3) conducting future projection at 5-year intervals (Future prediction). To validate the reliability of this dataset, a historical test was used to compare it with the WorldPop dataset at the provincial and grid levels (3569 provinces, almost all provinces and over 480,000 grids worldwide were included in the validation, as shown in Figure 3). The results show the reliability of the population projection data obtained from this study. In addition, the comparison with the existing related data also proves that this data can not only support the national level research, but also the urban scale (Figure 4).

Figure 1. Two examples are selected to show the population distributions for 5-SSP scenarios in 2100 and 2020. Figure 1a is New Delhi and surrounding cities in India. Figure 1b is Paris in France.

Figure 2. Flow chart of the methodology of this research.

Figure 3. Comparing the observed and predicted values at the sub-national and grid level on the globe in 2020. The top 8 figures (a total of 3569 red points) show the result of the sub-national level and the others (a total of more than 480,000 blue points) show the result of the grid level.

Figure 4: Comparison of this dataset with other related studies. Figures 4f and 4l are the data of this study, and figures 4c, 4d, 4i, 4j, 4e, and 4k are related data.
Associate professor Long Ying, from the Department of Urban Planning, is the corresponding author of this paper. Doctoral student Wang Xinyu is the first author of the paper, and postdoctoral fellow Meng Xiangfeng is the co-first author. This research is supported by the National Natural Science Foundation of China (NSFC) Project No. 52178044 and No. 51778319, and the Energy Foundation Project No. G-1909-30260.
The full text and data are available at the following links.
Full text link: https://www.nature.com/articles/s41597-022-01675-x
Data download: https://doi.org/10.6084/m9.figshare.19608594.v2
Sample code download: https://doi.org/10.6084/m9.figshare.19609356.v3


